SUPPORT / TECHNICAL RESOURCES
MEASUREMENT
PROTOCOL
For all our active studio monitors.
Understand how our technical specifications are measured, and the conditions behind the results.
TECHNICAL REFERENCE
The detail behind every specification.
Here is the explanation on how we proceed to get the measurements of the Technical Data.
| Parameter | Unit | Input signal | Measurement method |
|---|---|---|---|
| Potential peak power | [W] | Hann-burst of 1 cycle Frequency: middle of the bandwidth emitted by the driver in question | Amplifier without limiter with dummy load resistors of the same resistance as a the nominal impedance. The squared peak output tension is divided by the resistance value to give the potential peak power. |
| Max RMS power | [W] | Sinus Sweep @ clipping +6 dB | Done on the complete Monitor. Measurement of the voltage on the connections of each driver. The "Max RMS Power" is the squared value of the Max RMS voltage (Tau = 35ms) divided by the nominal impedance of the transducer. |
| Input impedance | [Ω] | Sine 20 Hz-20 KHz | A resistance is connected in series with the input of the monitor. The input impedance is equal to the resistance when the attenuation due to the resistance equals -6dB. |
| Input sensitivity | [Vrms] | Pink noise filtered to the announced "Bandwidth at -6dB" | The RMS voltage of the input signal is measured to obtain 90dB SPL at 1m in the axis of the speaker. This value is then multiplied by 3.16 to extrapolate the value for 100dB SPL @ 1m. |
| Input overload | [Vpp] | Sine 20 Hz-20 KHz | The maximum peak-to-peak voltage of the input signal is reached as soon as the output signal of the input circuit is clipped |
| Parameter | Unit | Input signal | Measurement method |
|---|---|---|---|
| Continuous max SPL@1m | [dB] | PN M 1040 weighted noise* Level: Limiter led flashing +6 dB | The maximum SPL @ 1m on axis is retained in RMS with a time constant of 250 ms (fast). |
| Short term max. SPL@1m | [dB] | PN M 1040 weighted noise* Level: Limiter led flashing +6 dB | The maximum SPL @ 1m on axis is retained in RMS with a time constant of 35 ms (250db/s). |
| Peak max. SPL@1m | [dB] | PN M 1040 weighted noise* Level: Limiter led flashing +6 dB | The absolute value (positive or negative) of the instantaneous peak SPL @ 1m on axis is retained. |
| Background noise @ 1m | [dBA] | Shorted input | The maximum value is obtained by successively measuring the weighted "A" SPL emitted at 0.1m by each transducer. 20 dB are then subtracted to extrapolate the result to 1m distance. |
| Signal to noise ratio (S/N) | The signal to noise ratio is the difference between the continuous max SPL @ 1m and the background noise @ 1m. |
| Parameter | Unit | Input signal | Measurement method |
|---|---|---|---|
| Bandwidth at -6dB | [Hz] | sine sweep 10 Hz-40 KHz | The bandwidth is measured at 90dB @ 1m on axis in between the lowest frequency and the highest frequency crossing 84 dB. |
| SPL tolerances | [dB] | sine sweep 10 Hz-40 KHz | The SPL tolerances are the admissible variations in dB of the frequency response within the announced bandwidth. |
| Phase tolerances | [°] | sine sweep 10 Hz-40 KHz | The phase tolerances are the admissible variations in degrees of phase response within the bandwidth. |
| Dispersion (H x V) | [°] | Pink noise 30 Hz-15 KHz | The speaker is oriented around an axis going through its SPL origin ** The limits of the dispersion angle are reached as soon as an octave band is attenuated by -6dB compared to the on axis SPL. The angle is given for the horizontal and vertical planes (HxV). |
| Directivity Factor | [.] | Log Chirp | The directivity factor is the on-axis pressure divided by the acoustic pressure radiated in every direction. The typical result is shown on a graph. |
| Distortion THD | [dB] | Sine sweep | A sliding sine signal is adjusted to obtain 90 dB @ 1m. The level of total harmonic distortion is the RMS value of the SPL of the sum of all upper harmonics. The typical result is shown on a graph referenced at 90dBspl. |
| Parameter | Unit | Input signal | Measurement method |
|---|---|---|---|
| System | [Nb of ways] | Number of drivers with different bandwidths. | |
| Crossover frequency | [Hz] | Frequency at which both drivers have identical SPL (typically -6 dB). | |
| Woofer ext. diam. | [mm] | The dimension is the diameter of the circle circumscribed around the transducer overall. | |
| Woofer ext. diam. | [in.] | The dimension is the diameter of the circle circumscribed around the transducer overall. | |
| W. diaphragm diam. | [mm] | The dimension is the average diameter of the surround suspension. | |
| W. diaphragm diam. | [in.] | The dimension is the average diameter of the surround suspension. | |
| Medium ext. dim. | [mm] | The dimension is the diameter of circle circumscribed around the transducer overall. | |
| Medium ext. dim. | [in.] | The dimension is the diameter of circle circumscribed around the transducer overall. | |
| M. diaphragm diam. | [mm] | The dimension is the average diameter of the surround suspension. | |
| M. diaphragm diam. | [in.] | The dimension is the average diameter of the surround suspension. | |
| Tweeter ext. dim. | [mm] | The dimension is the diameter of circle circumscribed around the transducer overall. | |
| Tweeter ext. dim. | [in.] | The dimension is the diameter of circle circumscribed around the transducer overall. | |
| T. diaphragm diam. | [mm] | The dimension is the average diameter of the surround suspension. | |
| T. diaphragm diam. | [in.] | The dimension is the average diameter of the surround suspension. | |
| Dimensions W x H x D | [mm] | The dimension of the cabinet without connectors, grilles, brackets, etc. | |
| Dimensions W x H x D | [in.] | The dimension of the cabinet without connectors, grilles, brackets, etc. | |
| Net Weight | [Kg] | Weight of the unboxed monitor without packaging. | |
| Net Weight | [lbs] | Weight of the unboxed monitor without packaging. |
| Parameter | Unit | Input signal | Measurement method |
|---|---|---|---|
| Mains voltage | [V, ±10 %] | During all measurements the mains voltage is kept within ± 2% of the nominal value. The loudspeaker must operateproperly within voltage variations of ± 10%. | |
| Mains max DC offset | [V] | An adjustable DC offset is added to the AC mains voltage. The maximum is reached as soon as a disturbance exceeds the tolerance. | |
| Standby consumption | [W] | The standby power consumption is measured in RMS at the mains input and with 12 V phantom voltage on the XLR input and with the input short-circuited. | |
| Quiescent consumption | [W] | Same as above but with no phantom voltage. | |
| Max continuous Power | [W] | PN M 1040 weighted noise* Level: Limiter led flashing +6 dB | The maximum continuous power is given by the manufacturer of the transformer. |
| RMS continuous consumption | [W] | PN M 1040 weighted noise* Level: Limiter led flashing +6 dB | RMS electrical consumption measured during the signal reproduction. |
| Max Relative humidity | [%] | Relative humidity not to be exceed during the storage and the use of the product. | |
| External temperature range | [°C] | Maximum and minimum temperature not to be exceeded during use of the monitor and to maintain good listening quality. |
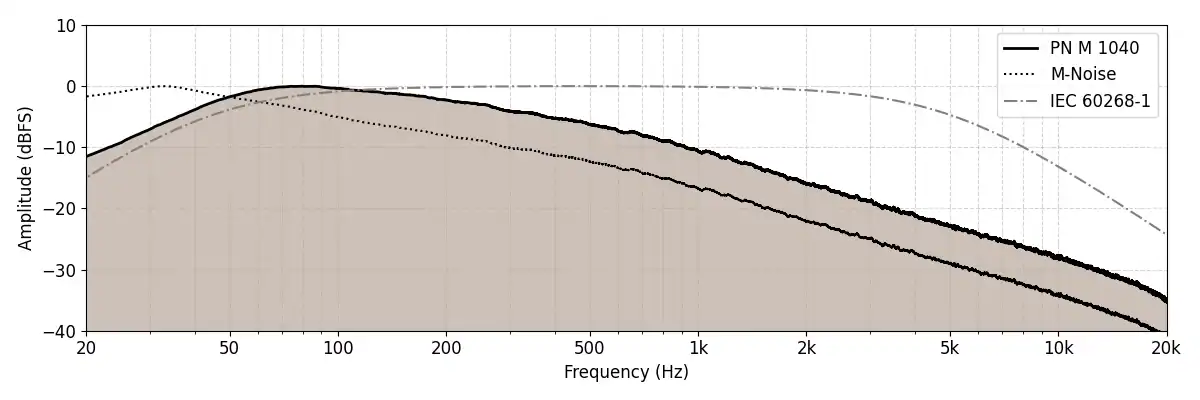
* PN M 1040 weighted noise — Pink noise with statistical music weighting
** Origin of SPL — Is the point beyond which the attenuation is proportional to the distance. This is determined by measuring the distance corresponding to 6 dB attenuation and subtracting this distance from the distance of the measurement point.
PSI Audio, March 2026 — Methods and figures can be updated anytime if improvements are made either in products or methodology
AES75 & OUR APPROACH
Measuring performance.
Reflecting music.
Note on the Use of AES75 as a Standard for Measuring Loudspeakers’ Maximum Linear Sound Level
For more than 30 years, PSI Audio has used a dedicated test noise designed to simulate music when measuring maximum SPL and evaluating loudspeaker reliability. This approach has provided consistent and meaningful results and has allowed us to develop and refine our monitoring systems over decades.
As measurement techniques evolve and new standards emerge, it is important to continuously refine how performance is characterized. The AES75 standard represents an important step in this direction by introducing a methodology that aims to better reflect real-world listening conditions. We therefore see AES75 as a valuable opportunity to further improve the way maximum linear sound levels are quantified and communicated.
Conclusion
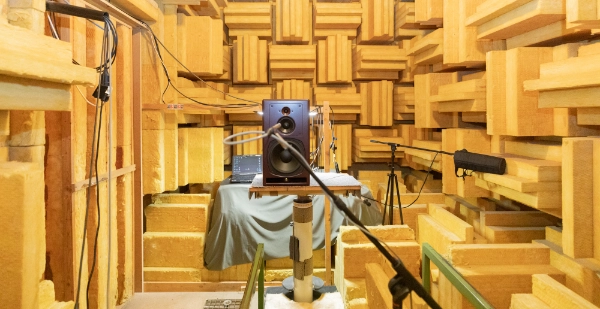
To validate this approach, measurements were first conducted in an anechoic chamber using the PN M 10/40 noise signal. These results were then compared with measurements performed in several real studio environments using both the same PN M 10/40 signal and a selection of music program material. The observed differences were consistently below 1 dB, confirming the strong correlation between this measurement method and actual listening conditions.
By combining long-standing measurement experience with evolving industry standards such as AES75, we continue to refine how loudspeaker performance is evaluated. This ongoing development supports our goal of improving our products and providing users with transparent and meaningful specifications when selecting monitoring systems.
PN M 10/40
Music-weighted pulsed pink noise.
A practical example used in our internal protocol: a 40-second cycle consisting of 10 seconds ON and 30 seconds OFF.